Founder-led · 2 founding build spots open this quarterBook your free Revenue Clarity Call →
Case study · No More Mondays

Numbers they couldn't trust. Then they just asked.

No More Mondays was a high-ticket coaching business running paid traffic into webinars and sales calls. The revenue was real — over $1M in seven months. The reporting wasn't. This is what changed when the data got honest.

$0.00M+
Closed revenue, tied to source (7 mo)
0
Deals, every one reconciled
6 → 0
Source systems into one warehouse
artiverse · no more mondays
$81K
$103K
$102K
$162K
$172K
$210K
$199K
DecJanFebMarAprMayJun
Cash collected, payment-processor side — Dec 2025–Jun 2026
Monthly cash collected (FanBasis + Whop, succeeded payments), Dec 2025 – Jun 2026 — reconciles to NMM's internal CFO dashboard to the dollar.
$1.03M collected over the window; $1.45M collected all-time (Jun 2025 – Jul 2026). The $1M+ closed-revenue headline above is contracted value from their closing-call records — June's share is still settling upward as dispositioning catches up.
The situation

Six tools, six versions of the truth.

Meta Ads, GoHighLevel, Calendly, Zoom, the payment processor, and a closing-call spreadsheet — six systems, each reporting a different number, none tied back to the cash that actually landed. Deciding what to scale meant picking which dashboard to believe that week.

The lie

The same close rate, told two ways.

Close rate · the same 258 deals, two definitions
9.4%
close rate
Deals ÷ every booked call

Same 258 deals. The number moves nearly 3× depending on whether disqualified and no-show calls sit in the denominator. Close rate counted calls that never had a chance to close; the honest rate — the one worth running a business on — was 27.9%. Show rate, once rescheduled calls stopped dragging it down, was 45.9%.

This ratio is measured on the fully-settled Dec–May window (258 deals) — June is included in the revenue headline above but held out of this comparison until its dispositioning finishes catching up.

What we built

The Revenue Clarity Engine.

A custom GoHighLevel-to-BigQuery pipeline pulled all six sources into one warehouse. A dbt semantic layer encoded eligibility rules so close rate, show rate, and CAC meant what the team thought they meant. End-to-end attribution tied every ad dollar to the closed payment it produced. And Claude, sitting on the warehouse, made all of it answerable in plain English.

The turn

Where the money actually came from.

Sunday webinar43%
Setter-booked (outbound)38%
Wednesday webinar10%
Everything else9%

38% of closed revenue came from setter-booked outbound calls — not the webinar it's easy to credit. And once ad spend was tied to cash, the picture sharpened by webinar too: the monthly workshop returned 7.6× on ad spend, more than double the Sunday (3.6×) and Wednesday (3.0×) webinars. That's the difference between guessing what to scale and knowing.
What they said
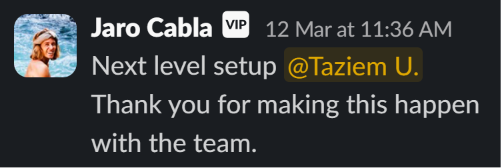
Jaro praising the build in the team Slack
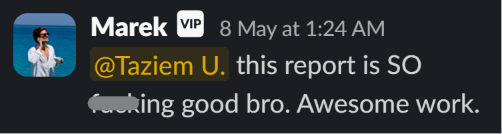
Marek praising the build in the team Slack
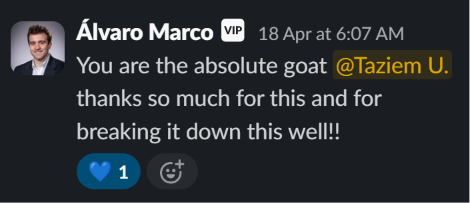
Álvaro praising the build in the team Slack
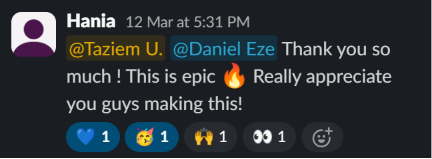
Hania praising the build in the team Slack

Want the same on your numbers?

Book a free Revenue Clarity Call
Revenue and deals figures cover December 2025 – June 2026 (seven months); the close-rate and show-rate figures are measured on the fully-settled December 2025 – May 2026 subset (258 deals), pulled from No More Mondays' own warehouse. Revenue is contracted value; cash figures are processor-side (FanBasis + Whop, succeeded payments) and differ from banked cash due to a BNPL reserve holdback. Close and show rates use eligibility-filtered definitions (disqualified and rescheduled calls handled explicitly). Shared with No More Mondays' consent.